

Applications of Sus domesticus tissue in the development of organic consumer products and insights into non-ohmic resistance in tissue
Abstract
Consumer products made from organic, living material are a potential area that could result in everyday products like toasters, cars, and massage devices possessing a lower carbon footprint to produce, reduce the strain on resource management at end of life, and could potentially self-repair. An avenue of investigation for the viability of organic products is the replacement of existing inorganic material for suitable organic material.
We investigated Sus domesticus tissue as a substitute insulator for copper wiring in consumer products. Our investigation found that the tissue was not a suitable insulator of electricity. However, observations were made to its properties as a non ohmic resistor, and the relationship between voltage, thermal denaturation, and changing resistance levels of the tissue. This helps us better understand what organic material isn’t suitable to act as an insulator.
Introduction
Copper is used in electrical wiring in homes, in part due to the concept of resistivity (⍴). Pasquale et al. (2024) states that copper has a ⍴ of at room temperature making it a good conductor of electricity. On the other hand, they state that quartz is a good insulator of electricity with a ⍴ value of .
This study will investigate if consumer products can be developed that are comprised of organic tissue. This has applications in products where consumers require tactile texture, temperature, and movement like that of living tissue.
A preliminary investigation sought to assess the viability of replacing copper wiring with organic tissue, with the vision to grow living homes comprised of flesh. The expected outcome being, a potentially carbon neutral abode that can self-repair and potentially act as a companion.
This experiment was set up as a series circuit to test if tissue taken from S. domesticus could replace copper to allow a light to operate when connected to a power source. Grocery sourced raw pork was used for proof of concept and to support further investigations requiring ethical approval. Findings showed this was not possible, as the tissue appeared to have a high resistivity, preventing the light from operating. The project was adapted to then investigate the resistivity properties of thetissue to see if it could insulate copper wiring.
Copper wiring can be insulated with several materials; Polyvinyl Chloride is an insulator found commonly in consumer products. Titow (1984) states that this material has a resistivity of .
Our investigation asks, can S. domesticus tissue act as safe and effective insulator of electricity for consumer products. Our null hypothesis being that S. domesticus tissue cannot be safely used as an insulator.
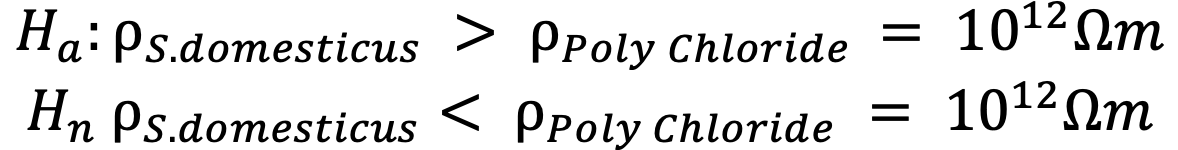
To support the hypothesis or null hypothesis we will use:
Method
Our study used four samples of S. domesticus tissue given identifying names of Khorne, Tzeentch, Slaanesh, and Nurgle. Each sample was exposed to a variable change in voltage, with the voltage increasing incrementally from 0v, 4v, 6v, and finally 8v. Current acted as a dependent variable per ohms law .
The dimensions of each sample were measured to calculate resistivity, for this we used . To measure the tissue, it was gently splayed against a ruler and measurements taken in millimeters. Time was given for fascicle contraction to stabilize. Sample measurements and cross-sectional data can be seen in Table 2.
Controls were established to ensure all samples were exposed to the same circuit set up, wires, connection points, monitoring tools, and power source.
The circuit was set up in series, with copper wires from the + and – terminals of the power source connected to the distal and proximal ends of each sample. A multimeter to record current was connected to the + terminal of the power source and the proximal end of the sample. A voltmeter was connected to the proximal and distal ends of the sample (Figures 1 and 2).
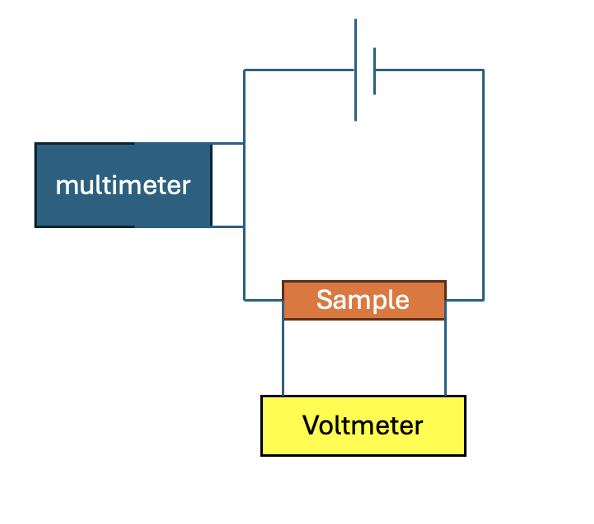
Figure 1 Technical Drawing of Figure 2
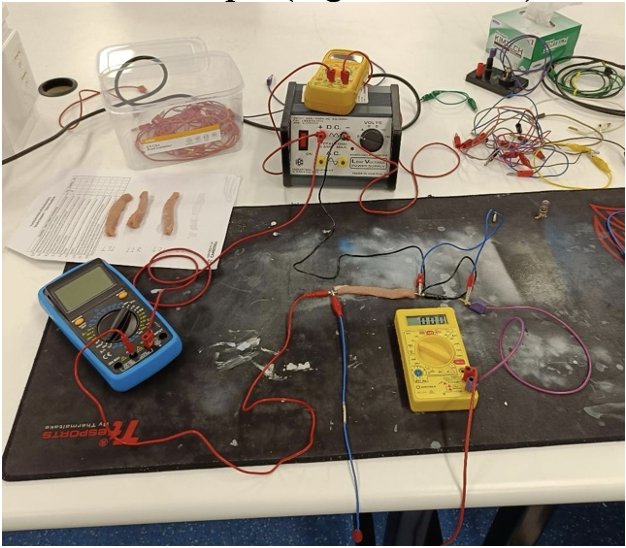
Figure 2 Actual photo of Figure 1. Visible are the four samples used for the investigation, the photo shows Tzeentch being exposed to 0v.
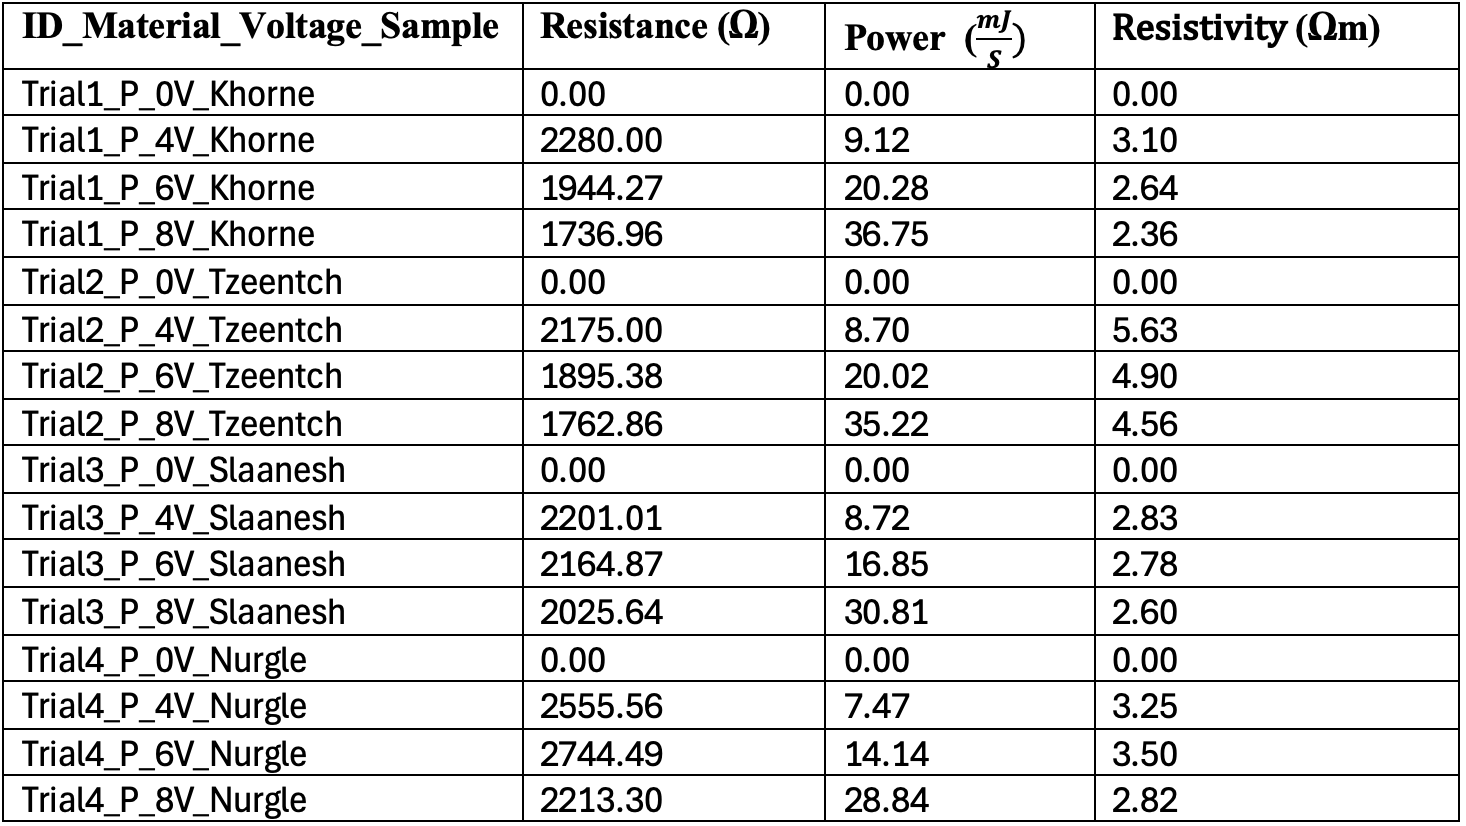
Each sample was tested at 0v, 4v, 6v, and 8v before it was replaced by the following sample. Time was given for readings to stabilize before recordings were taken.16 trials were run in total. Resistance, Resistivity, and Power for each sample are shown in Table 3.
Group Photo Requirement: The group involved in collecting data for this investigation, Vixen Starshadow and Caleb Danser
Results
Across all four samples, when 0v was applied an amount of current was detected with a range of 0.02 mA to 0.03 mA. This current was only detected by the multimeter when connected to the samples, the device read 0mA when powered on and not connected to a sample.
When voltage was applied (4v, 6v, 8v), resistance and resistivity were inversely proportional to voltage. Of note, Nurgle recorded higher resistance and resistivity but still followed the inversely proportional pattern between voltage and resistance as Khorne, Tzeentch, and Slaanesh.
Graph 1 shows the relationship between voltage and current for each sample. The graph follows a polynomial trendline (Wettstein 2022). values (Table 1) demonstrate a high degree of fit for polynomial trendlines (Pennsylvania State University 2018), though it should be noted Nurgle had the same value regardless of polynomial or liner trendline.
Graph 1 Volts vs Current Table
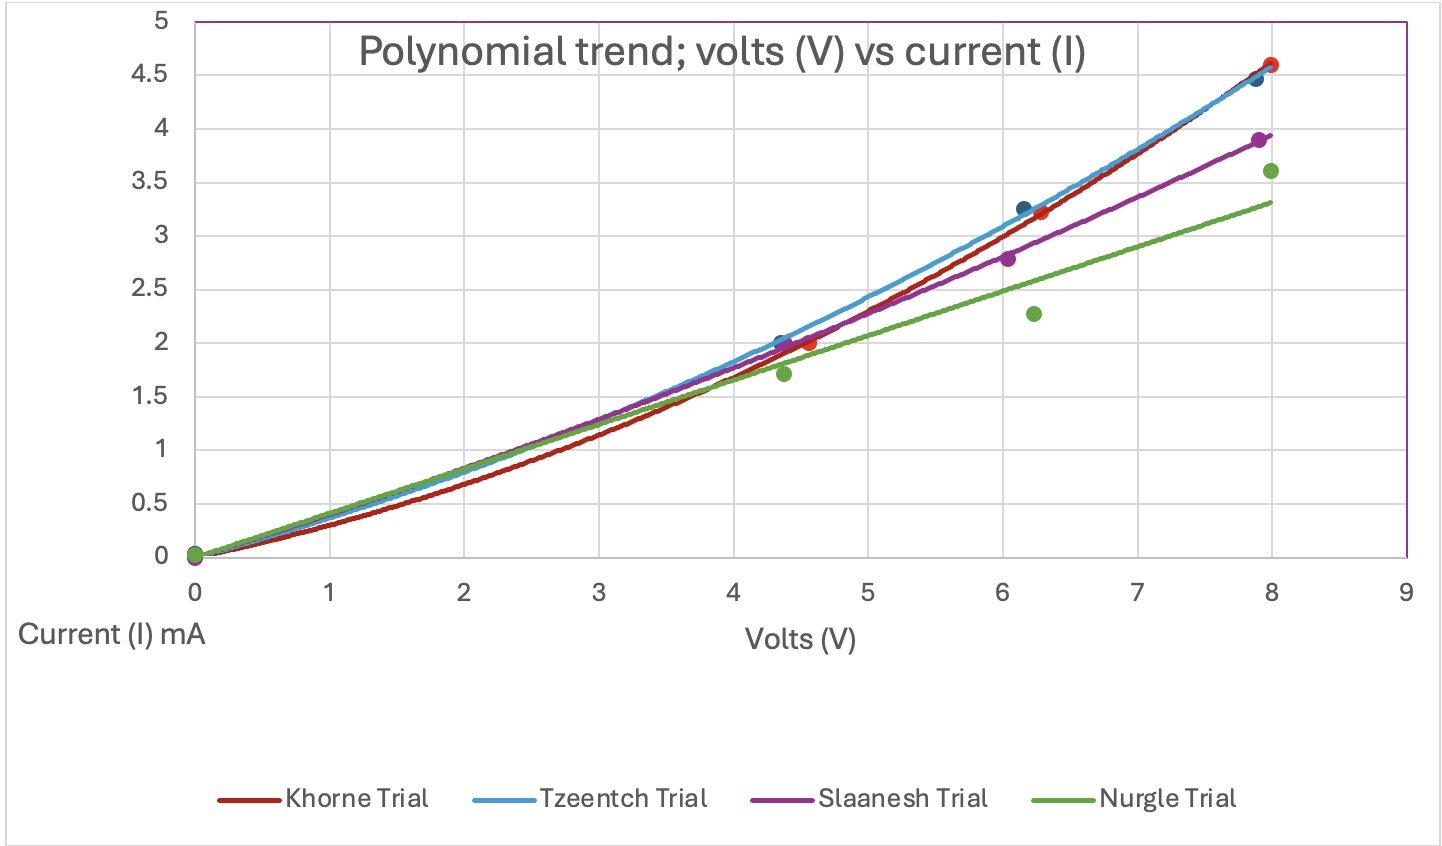
Graph 1 Volts vs Current Table
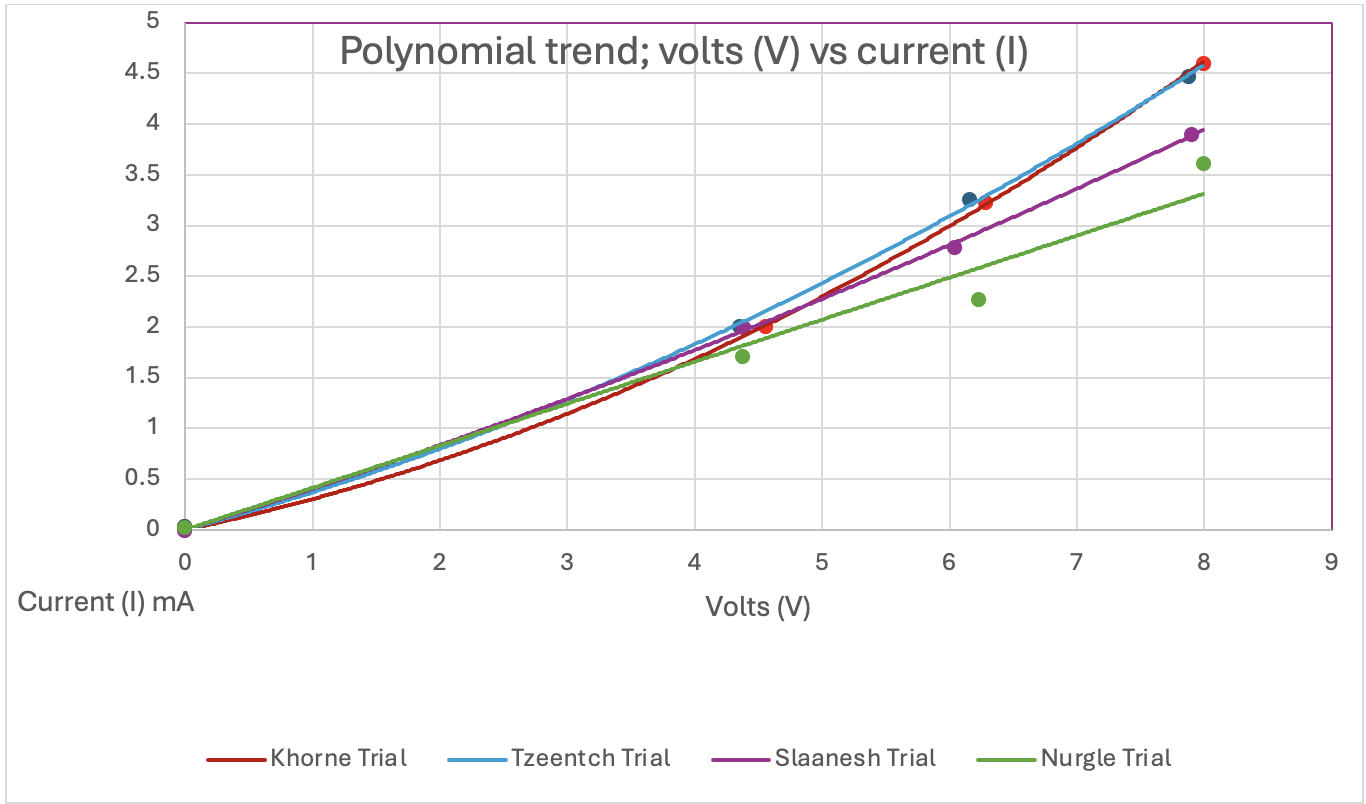
Table 1: R Squared values for Volt vs Current
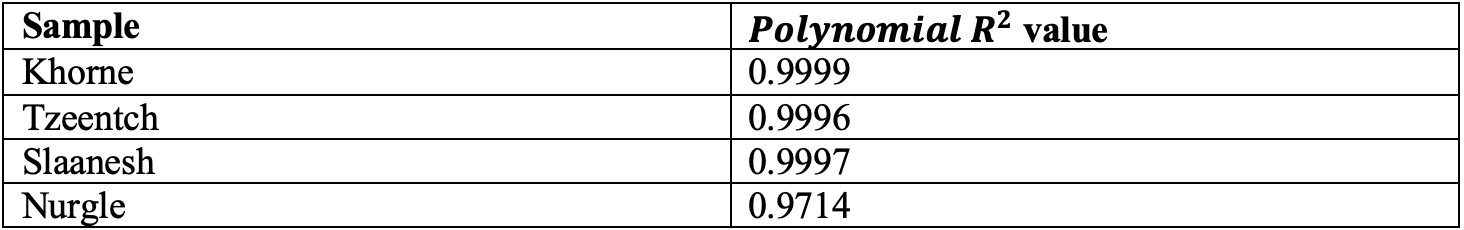
Table 2 shows the dimensions of each sample. Cross-sectional area standard deviation was 5.13×10⁻⁵ m². Tzeentch recorded the largest cross-sectional area with a Z-score of +1.50, indicating it sat 1.50 standard deviations above the mean. Khorne recorded -0.49, while Slaanesh and Nurgle were both -0.51 standard deviations from the mean.
Table 2 Sample Cross Sectional
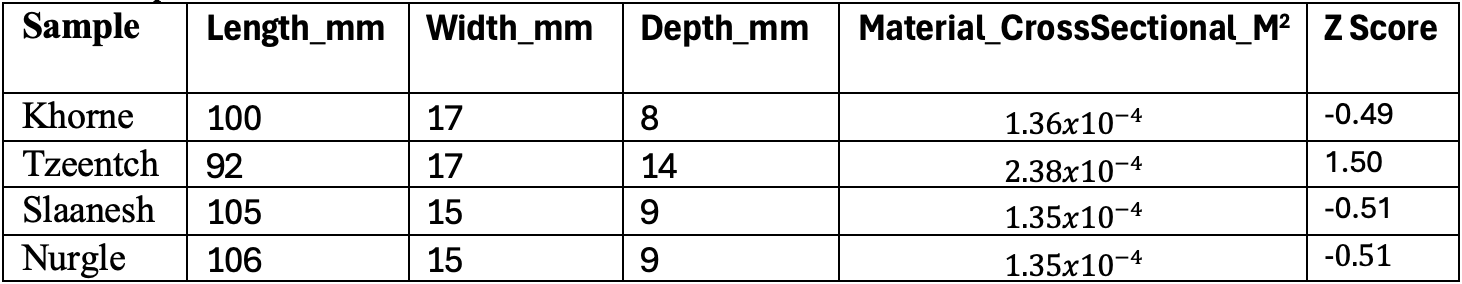
Table 3 presents the resistance, power exposure, and resistivity of each sample. Across all samples, Resistance ranged from 1736.96 Ω to 2744.49 Ω. Power measured as mW increased with voltage. As volatage increased resistivity and resistance decreased.
Table 3 Sample Resistance/Power/Resistivity
We noted Tzeentch had observable changes to colour and texture at connection points. We hypothesise this is due to thermal denaturation, cooking of the tissue due to exposure to electricity. Time as a variable was not recorded, but, it was observed Tzeentch had been connected to live power longer than the other samples which did not experience colour and texture change.
Table 4 Confidence Intervals at 0.95
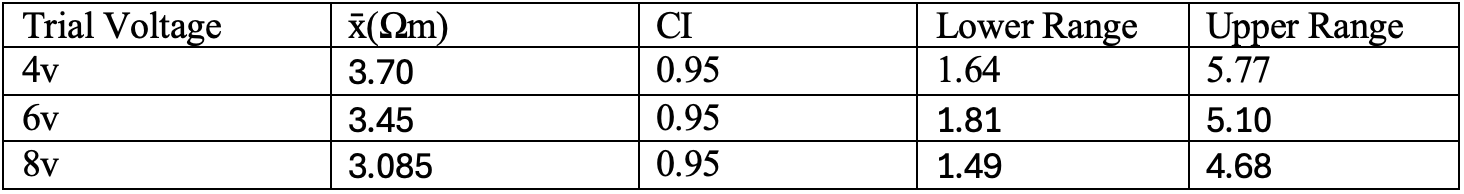
Table 4 presents the 95% confidence intervals for mean resistivity (Ωm) at each voltage level (4V, 6V, 8V) across all four samples. 0v samples were excluded as their Ωm value was 0 in each test.
Metadata, raw and cleaned including calculations are available in the supplementary data at the end of this report.
Discussion

Among all trails (0v, 4v, 6v, 8v) there was a mean resistivity of 2.56 Ωm. Contrasted to Polyvinyl Chloride which has a resistivity of , we can see that S. domesticus tissue had a lower resistivity value and thus we fail to reject the null hypothesis;
The data shows that S. domesticus tissue has higher levels of resistivity comparted to copper. It also shows it is not as good an insulator as Poly Chloride. Given that one sample was observed to have begun thermal denaturation when exposed to electricity for an extended time during the experiment, we can hypothesise a trend suggesting that with time the properties of the S. domesticus tissue will change when acting as a insulator, resulting in an unstable material for insulation.
This leads to one of the more interesting observations, which is the indication that S. domesticus tissue acts as a non-ohmic resistor. Pasquale et al. (2024) reads; “Ohms law states voltage is proportional to current”. A polynomial trendline (table 1, graph 1) for the voltage vs current graph, suggests resistance is not proportional and suggests non-ohmic resistance (RMIT University 2012).
Further As seen in table 4, the resistivity values between 4v and 8v becomes narrower. Paired with table 1, and graph 1 depicting a polynomial line there is evidence suggesting that as the tissue denatures, its resistivity changes. As electricity is applied to the tissue, an amount of heat is transferred into the flesh. The tissue when exposed to thermal energy denatures, and thus the properties for resistance also change (Liu et al. 2025). The higher the voltage applied, the lower the resistance.
It should be noted table 4 shows a CI of 0.95, the samples at 4v (1.64, 5.77), 6v (1.81, 5.10), and 8v (1.49, 4.69) ranges are wide, the CI is directly impacted by a small sample size. A larger sample is required to build on this suggested trend.
This study had some limitations, firstly the amount of time the tissue was exposed to electricity was not recorded, so we cannot extrapolate a solid conclusion based on exposure time outside qualitative observations. Additionally, allowing more time for the tissue to denature would have provided some insight into the continuance of the non-ohmic trend.
The second limitation of this investigation is that temperature of the samples was not recorded. Prior to the commencement of the experiment, the samples had been stored in an ice box. The first sample, Khorne, was below room temperature at the start of the experiment. However, the final sample Nurgle, had time to acclimatize outside the ice box while the other three samples were investigated. Nurgle presented with a trendline that had the same value for a linear or polynomial trendline. This suggests that temperature could also impact results. If this variable had been recorded, we could investigate how temperate affected non-ohmic resistance in tissue. We believe testing these variables would prove for an interesting continuation of this experiment for a group for next semester’s independent investigation.
An additional thought about this is that we tested non-living tissue. If this experiment had been performed on living tissue governed by principles of homeostasis to better regulate material temperature there may have been a different result in relation to denaturation of the tissue. Controlling for temperature in a future experiment would provide insight into this. Additionally, lower voltage as an application may yet be suitable if exposure time shows no thermal denaturation.
We suspect living tissue may be suitable for consumer products, but in applications where it is it used as an outer layer for cushioning or creating a textile layer. The investigation concludes that S. domesticus tissue would not be a good insulator of electricity.
References
1. Liu, Y, Gu, Q, Huang, M, Zhao, Y, Guo, Z, Zuo, H, Zhu, L & Zhang, Y 2025, 'Investigating the effects of protein thermal denaturation on the water-holding capacity of beef: insights from structural dynamics', International Journal of Food Science and Technology, vol. 60, no. 1, article vvaf076, doi:10.1093/ijfst/vvaf076
2. Pasquale, A.J., Fazzini, D.R. and Bennett, C. (2024) Conceptual Physics. Glen Ellyn: College of DuPage Digital Press. Accessed: 15 April 2026.
3. Pennsylvania State University 2018, '2.5 - The Coefficient of Determination, r-squared', STAT 462: Applied Regression Analysis, Eberly College of Science, Pennsylvania State University, viewed 15 April 2026, Accessed: 15 April 2026.
4. RMIT University 2012, PE1.2: Ohm's Law, RMIT Learning Lab, RMIT University, viewed 15 April 2026.
5. Titow, WV 1984, PVC Technology, 4th edn, Elsevier Applied Science Publishers, London, ISBN: 0-85334-249-0. Accessed 16 April 2026.
6. Wettstein, SG 2022, Technical Writing and Simple Statistics: for laboratory classes, Montana State University Library, DOI: 10.15788/20221116. Accessed 15 April 2026.